
Visual tools play an important role in identifying and addressing the root causes of issues. A powerful tool to consider is the fishbone diagram. Named for its distinctive, skeletal appearance that resembles a fish’s bones, this diagram helps teams systematically explore and display the various potential causes of a problem.
Whether you’re working in manufacturing, healthcare, education, or any other field, understanding how to use a fishbone diagram can significantly enhance your ability to diagnose issues and implement effective solutions. In this blog post, we’ll explore what a fishbone diagram is, how it works, and how you can utilize it to boost your problem-solving efforts.
What is a fishbone diagram?
https://www.youtube.com/watch?v=xkey1qByic4
A fishbone diagram is also known as an Ishikawa diagram or a cause and effect diagram. It is one of the most popular Lean tool used for cause and effect analysis to uncover the root cause of a problem. Essentially, this diagram is fundamentally a causal analysis tool designed to visually map out the causes and sub-causes that lead to a particular issue or effect.
By facilitating a structured brainstorming session, fishbone diagrams help teams collaboratively explore and prioritize potential causes. Therefore, leading to more effective problem-solving and decision-making. This organized approach not only aids in discovering the root cause, but also highlights areas for improvement. Ultimately, enhancing the efficiency and quality of processes within any organization.
The history of fishbone diagrams
The fishbone diagram was developed by Japanese organizational theorist Dr. Kaoru Ishikawa in the 1960s. Initially, it was conceptualized to improve quality management processes in the Kawasaki shipyards. However, the fishbone diagram quickly gained recognition for its effectiveness in identifying the root causes of problems.
Over time, this tool has been widely adopted across different industries around the world. In fact, it has become a fundamental technique in quality control and problem-solving methodologies. Its simplicity and clarity continue to make it a valuable asset for teams aiming to systematically explore potential factors impacting their processes.
Understanding the fishbone diagram structure
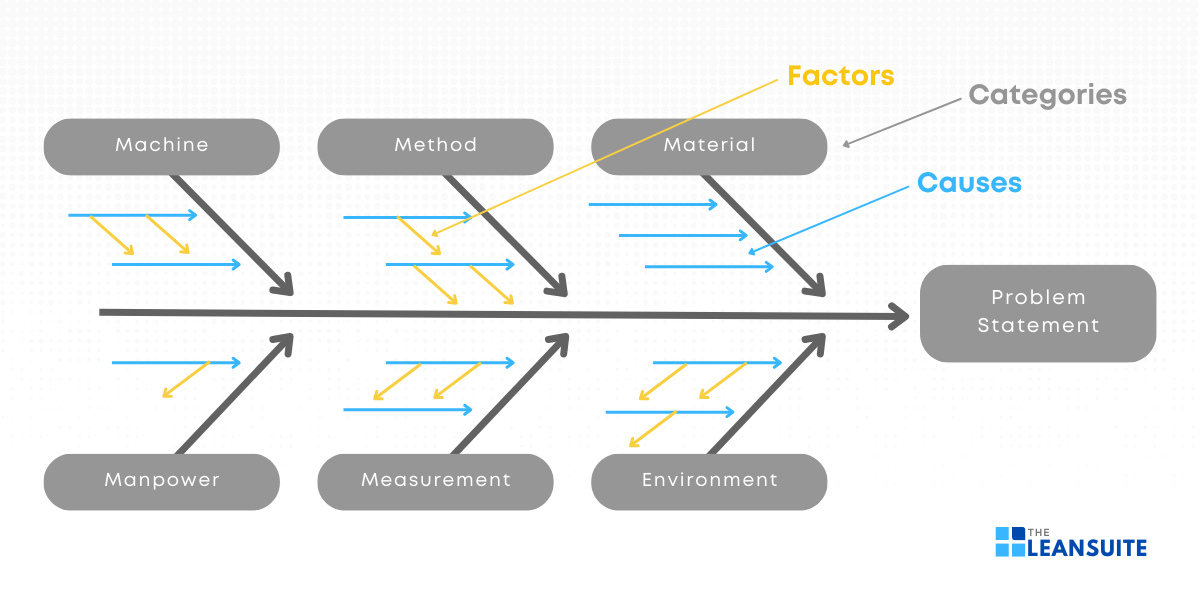
A fishbone diagram gets its name from its resemblance to a fish skeleton, with a central horizontal line or “spine” and branching “bones.”
On the left side of the diagram, the causes of the problem are listed. These major causes are broken out into cause categories, which are also known as the 5 M’s of manufacturing:
- Machine: This category includes issues related to equipment and machinery. For example, malfunctions, wear and tear, or lack of maintenance.
- Method: This involves the processes and procedures followed in production, including workflows, techniques, and operational protocols.
- Material: This category covers problems related to the raw materials or components used in production. For instance, quality issues, availability, or variability.
- Manpower: This includes human factors like worker skills, training, communication, and workforce management.
- Measurement: This pertains to the measurement systems used to ensure quality and performance, including calibration, data accuracy, and monitoring tools.
- Mother Nature (Environment): Sometimes an additional M is considered, which involves environmental factors. This includes examining external elements such as weather conditions, workplace environment, and other external influences that might affect the problem.
Each of these major cause categories is represented as a “bone” branching off the central spine of the diagram. Sub-causes and contributing factors are further detailed along each bone. Thus, creating a detailed map of potential reasons behind the problem.
On the right hand side of the diagram, also known as the fish’s head, the effect is listed, written as the problem statement. This is the specific issue or undesirable outcome that the team is seeking to address or understand.
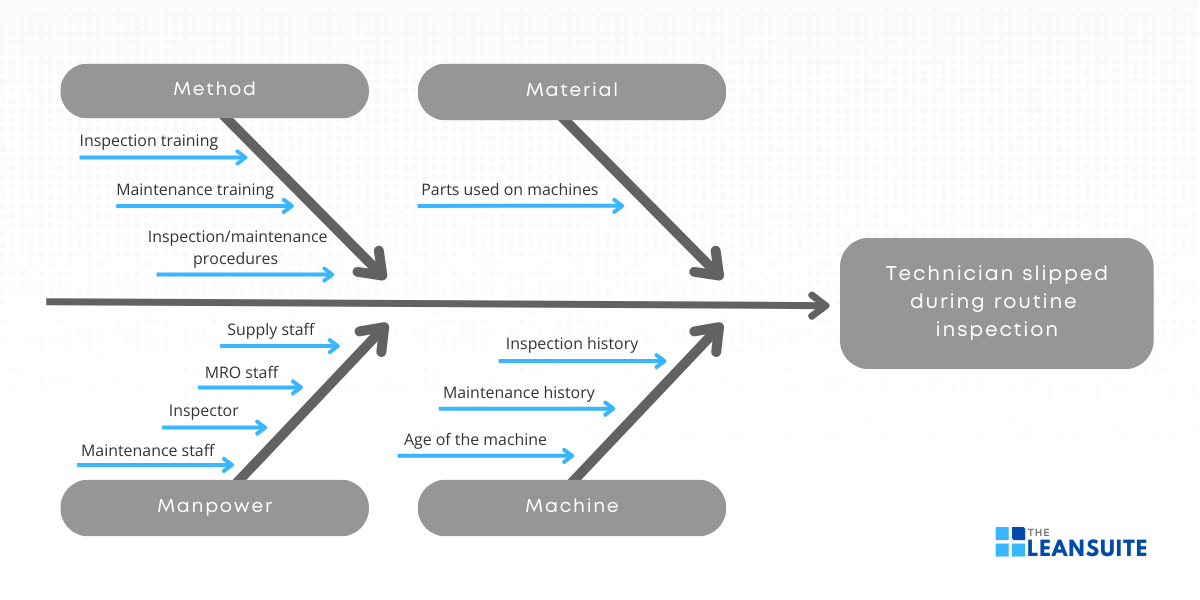
A practical example of a fishbone diagram
Here is a practical example of a fishbone diagram to illustrate its real-world application. The image below will help you visualize how this tool can be used to systematically identify and address the root causes of complex problems.
How to create a fishbone diagram
Here are four simple steps that will help you craft a clear and insightful fishbone diagram, enabling you to analyze issues with precision and develop actionable solutions.

1. Identify the problem
The first step of creating a fishbone diagram is to clearly define the problem you are aiming to solve. This problem should be specific and clear so that everyone involved understands precisely what needs to be addressed.
An example:
- Problem statement: “High employee turnover rate in the customer service department.”
Action steps:
- Gather relevant stakeholders to ensure that the problem is accurately identified.
- Write a clear and concise problem statement.
- Place this problem statement at the head of the fishbone diagram, typically at the rightmost end.
2. Brainstorm the major categories of causes
The next step is to brainstorm the major categories that might be influencing the problem, each representing a contributing factor. These categories are typically the main branches of the fishbone diagram.
Common categories:
- Machine: Tools and equipment that might be contributing to the problem.
- Method: Procedural issues, including workflows and standard operating procedures.
- Material: Any raw materials or supplies that could be affecting the outcome.
- Manpower: Issues related to staff, such as skills, training, and morale.
- Measurement: Data and metrics being used to measure performance.
- Environment: Physical and organizational environment, including work conditions and culture.
Action steps:
- Conduct a brainstorming session with key stakeholders to identify relevant categories.
- Ensure that the categories are broad enough to cover all potential causes, but specific enough to be useful.
3. Identify possible causes
Once the major categories are established, the next step is to drill down into each category to identify specific causes. This is where the 5 Whys Analysis can be extremely useful. The 5 Whys technique involves asking “why?” multiple times (typically five) to drill down to the root cause of each issue. If causes are related to multiple categories, they can be repeated.
An example:
- Category: People
- Issue: Lack of training.
- Why? Employees are not attending training sessions.
- Why? Training sessions are scheduled at inconvenient times.
- Why? Training department is unaware of employees’ work schedules.
- Why? No communication between departments.
- Why? Lack of a formal communication process.
Action steps:
- For each major category, ask “Why is this happening?” and write down the answers.
- For each answer, ask “Why?” again, and continue this process until you reach the underlying cause.
- Create the fishbone diagram with these detailed causes, branching off from the main categories.
4. Analyze the diagram
After populating the fishbone diagram with detailed causes, the final step is to analyze the diagram to identify the most likely root causes of the problem. This analysis helps in developing effective solutions.
An example:
- From the analysis, it may become evident that the primary cause of high turnover is “Lack of a formal communication process.” This can then be addressed by implementing a structured communication system between departments.
Action steps:
- Review the entire diagram with the team to ensure all potential causes have been captured.
- Prioritize the causes based on their impact and likelihood.
- Identify which causes are controllable and actionable.
- Develop a plan to address the root causes, including actionable steps, responsible parties, and timelines.
Benefits of using a fishbone diagram
Unlocking the full potential of problem-solving in your business can seem daunting, but with the right tools, it becomes much more manageable. In this section, we’ll explore the four main benefits of using a fishbone diagram.
1. Targeted visualization
A fishbone diagram provides a targeted visualization of potential causes of a specific problem. By organizing causes into categories, it allows teams to visually pinpoint areas of concern and understand the relationships between different factors. In other words, this structured approach makes it easier to identify root causes. This, in turn, makes it particularly useful in complex scenarios where multiple variables may be at play.
2. Determines bottlenecks and solutions efficiently
The systematic layout of a fishbone diagram helps in quickly identifying bottlenecks and potential solutions. By categorizing issues and visually mapping them out, teams can efficiently focus on the most critical areas that need attention.
In essence, this method ensures that no potential cause is overlooked, and it simplifies the process of brainstorming solutions. Thereby, leading to more effective problem-solving and decision-making.
3. Improvement-oriented approach
Fishbone diagrams encourage a continuous improvement mindset by focusing on identifying and addressing root causes rather than just symptoms. This proactive approach fosters a culture of ongoing assessment and enhancement. Thus, driving organizations to constantly seek better ways to operate.
By regularly using this tool, teams can develop a habit of examining processes and implementing improvements. As a result, this leads to long-term gains in efficiency and productivity.
4. Enhances team understanding
Creating a fishbone diagram is typically a collaborative effort that enhances team understanding and communication. So, by involving diverse team members in the process, it leverages different perspectives and expertise. Therefore, leading to a more comprehensive analysis.
This collaborative approach not only builds a shared understanding of the problem, but also promotes a sense of ownership and accountability among team members. Consequently, fostering a more cohesive and motivated work environment.
Conclusion
In conclusion, fishbone diagrams, also known as an Ishikawa Diagram or a cause and effect diagram, are a powerful tool for root cause analysis. That is to say, they play a crucial role in enhancing problem-solving and decision-making processes and can be effectively utilized in a variety of settings, from business environments to personal projects.
By following the steps outlined in this guide, you can create an effective fishbone diagram that will help you address issues systematically and improve your processes. Embracing this method can lead to more informed decisions and better outcomes. Ultimately, making problem-solving a more structured and efficient process.